


November 9, 2026
LLM Observability Tools: How Enterprises Monitor GenAI Quality in Production
Enjoying this article?
Share it with the world!


LLM Observability Tools: Which One Fits Your Team?
| ⚡ Quick Answer LLM observability means collecting enough data from a GenAI app to explain what it did and why: logs to reconstruct a bad answer, metrics to watch tokens, latency and quality over time, and traces to follow one request through retrieval, prompt assembly, the model and guardrails. It matters because an LLM app can return 200 OK all day while giving wrong answers, so traditional uptime monitoring never fires. Track four groups together (quality, performance, cost and security), pick a tool that matches how your team already works, and use LLM-as-a-Judge on a sampled slice of traffic to measure quality at scale, validated against human review. |
A GenAI demo takes an afternoon. You grab an API key, write a prompt, and the answers look great. Your boss is happy. Everyone goes home.
Real users change the story fast. One of them asks something odd that you never tested. The bot replies with a wrong answer, and it sounds totally sure. Then the invoice arrives and it’s way over what you planned. Somebody pastes a credit card number into the chat. You find out when a customer emails you.
Here’s the odd part. Nothing “breaks.” A regular app crashes or throws an error, so you notice. An LLM app can return “200 OK” all day while giving bad answers. Your dashboard stays green and your users get misled.
That’s why enterprise LLM observability matters. In this post we’ll cover what it means, what to measure, which LLM observability tools people use, and how LLM-as-a-Judge lets you check quality without reading every single reply.
| Industry Insight The gap between a demo that works and a system that survives real users is the single most common reason GenAI projects stall. We looked at why in Why Most Generative AI POCs Never Reach Production. |
What Is LLM Observability?
It means you collect enough data from your AI app to explain what it did and why. A user gets a weird answer? You can go back and see what happened. Costs jump on a Tuesday? You can trace it back that same morning.
Three types of data make this work.
Logs are the raw records. The user’s prompt, the model’s reply, the data sent to any tool the model called, plus small details like model version and customer ID. When something goes wrong, the logs let you reconstruct the request and investigate what happened. An exact replay is not guaranteed, though, because model outputs, retrieved context, tool results and external state can all have moved on since.
Metrics are numbers you watch over time. Token counts, latency, Time to First Token (TTFT) on streaming calls, error rates, quality scores. They tell you if things are improving or slipping.
Traces follow one request from start to end. A single question might go from the user to vector search, then prompt assembly, then the LLM, then guardrails. If the final answer is bad, the trace shows which step caused it. Maybe search pulled the wrong document. Maybe the prompt got cut off. Without a trace you’re guessing, and guessing is slow.
| Start Here This post goes deep on the tooling. For the wider picture – the full metric set, agent-level tracing, RAG monitoring and how to roll it out across an enterprise – see our guide to AI observability. |
How is LLM observability different from traditional monitoring?
Traditional monitoring cares about whether your system is up and fast. CPU, memory, uptime, error codes. All useful. None of it can see the biggest GenAI risk, which is bad content.
LLM observability looks at what was actually said. Was the answer true? Helpful? Safe? Worth the money? An old tool might tell you the API answered in 800 milliseconds. It won’t tell you the answer invented a refund policy that doesn’t exist.
What is the difference between LLM monitoring and LLM observability?
People use the two words like they mean the same thing. They don’t quite.
Monitoring tells you something is wrong. A chart turns red, an alert pings your phone.
Observability helps you find out why. You get the logs, traces and scores to dig into the cause.
| Key Takeaway A smoke alarm is monitoring. Walking through the house to find where the fire began is observability. You need both, and most LLM monitoring tools work better when a solid observability setup sits underneath them. |
Key Metrics Enterprises Must Monitor
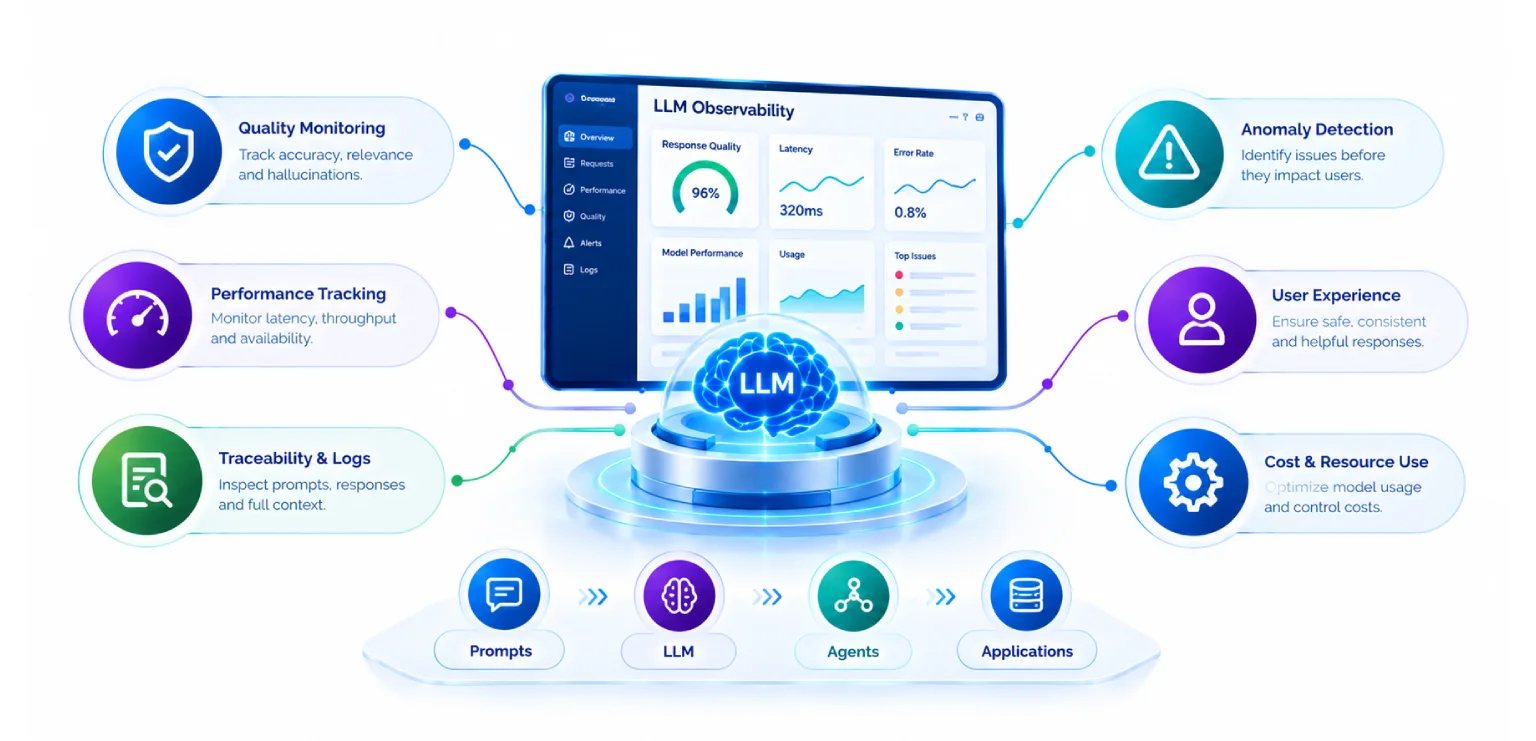
You could track a hundred numbers. Most teams are fine with four groups.
Response Quality
This one gets skipped most often, even though it matters most. Answer correctness is the obvious one: is the reply actually right? Relevance asks whether it addressed the question that was put to it. Faithfulness is about whether the model stuck to your source documents or started adding things of its own. Then comes the measure of how often it makes things up. There is no standard metric called a “hallucination index”, so pick a clearly specified hallucination rate or groundedness score and write down the evaluation method behind it, including who or what does the judging and against which reference. Task success rate rounds the group out: did the user get what they came for?
Performance and Reliability
Nobody likes waiting, and a slow bot feels broken. Start with end-to-end latency, the full time from question to finished answer. Time to First Token matters too, but it belongs to streaming responses: TTFT measures how long until the first token or chunk reaches the user, and a fast first word makes an app feel quick even when the rest takes a moment. On a non-streaming call there is no first chunk to time, so what you have is total response latency. Keep the two apart on your dashboards. Time each step separately (retrieval, prompt building, the model call) so you know which one is dragging. Provider error rates and API retries are worth tracking as well. Model providers have bad days like everyone else.
Cost and Resource Utilization
Costs creep up when you’re not looking. One bad loop in your code can burn real money overnight. Track input and output tokens separately and price them separately, since rates differ by model and by provider and output usually costs more than input. Cost per request and per tenant tells you who’s spending what. Sudden token spikes often mean a bug or someone abusing the app.
If you run a semantic cache, watch the hit rate. Reusing a past answer for a similar question saves money and time, but “similar” is doing a lot of work in that sentence. Two users can ask the same words and still be entitled to different answers. Scope cache keys by tenant and by what the asker is allowed to see, and expire entries when the underlying data changes, or you will serve one customer’s answer to another, or yesterday’s answer to today’s question.
Security and Responsible AI
Keep an eye on prompt injection, where users try to trick the model into breaking its rules. Watch for PII exposure, like names, phone numbers, and health or bank details leaking out. Guardrail violation rates matter too, since they show how often your safety checks had to step in.
| Key Takeaway For enterprise LLM observability, try to see all four groups on one screen. When quality sits in one tool, cost in another and security in a third, nobody sees the full picture. This is the main reason teams look for a single AI observability platform. |
Popular LLM Observability Tools
The market is crowded, but the tools sort into four recognisable camps. Work out which camp you belong in and the shortlist gets short quickly.
What are the best LLM observability tools?
Honestly, there’s no single winner. It depends on your stack, your privacy rules and how big your team is. The LLM monitoring tools on the market fall into a few camps.
| Four Camps, Four Starting Points Open-source and self-hosted Langfuse · Arize Phoenix Strict privacy or residency rules. The observability store stays in your network; model APIs and integrations can still move data out. Framework-native LangSmith Already building with LangChain or LangGraph. Debugging agent steps and testing prompts. Gateway or proxy Helicone Base-URL swap covers simple calls. Multi-step chains need session headers and per-integration logging. Enterprise APM integration Datadog LLM Observability Sits beside your other services, but needs its own LLM instrumentation rather than standard APM tracing. The useful question is which one fits how your team already works. The four camps, the tools in each, and the situation each one suits. |
| Open-source and self-hosted. Langfuse and Arize Phoenix. Good for teams with strict data privacy or data residency rules. You run them on your own servers, so the observability store stays in your network — though external model APIs, telemetry exporters and third-party integrations can still move data out, so map those paths too. Langfuse is liked for tracing, prompt management and evals. Phoenix is built on OpenTelemetry and OpenInference instrumentation, and covers tracing, LLM-based and code-based evaluation, datasets and experiments, and prompt management alongside a playground for replaying calls. Debugging retrieval problems in RAG apps is one thing it does well rather than the whole of it. | |
| Framework-native. LangSmith. If you already build with LangChain or LangGraph, this one feels natural. It’s great for debugging agent steps and testing prompts. | |
| Gateway or proxy. Helicone. It sits between your app and the model provider. For straightforward OpenAI-compatible calls, pointing the base URL at the gateway can be enough to get logs, cost tracking and rate limits. Capturing a complete multi-step RAG or agent workflow asks for more: related calls are grouped into a session using request headers, and vector database queries and tool calls are logged through their own integrations. Quick to start, with real work left if you want the whole chain in one view. | |
| Enterprise APM integration. Datadog LLM Observability. If your company already lives in Datadog, LLM calls can sit next to your other services. It needs its own LLM Observability instrumentation to capture LLM spans, though, rather than picking them up from standard APM tracing. Datadog’s SDKs auto-instrument supported frameworks and providers, and compatible OpenTelemetry spans and other supported ingestion methods work too. How much of your workflow lands on one screen depends on how much of it you instrument. |
Any of these can serve as your AI observability platform. The useful question is which one fits how your team already works.
Should you build or buy LLM observability?
For most teams, don’t build it. Buy something or use open source.
Building looks easy at first. Store some prompts, draw a few charts. Then people ask for trace views, evaluation workflows, prompt versions, alerts, access control and a decent UI. Soon you’re maintaining a whole product, and it’s not the one your company sells.
There are cases where building makes sense. Very unusual compliance rules, huge scale, or a platform team with spare time. Even then, a good middle path is to follow open standards and host an open-source tool yourself.
| Still not sure which camp you are in? The four camps look similar on a vendor page and behave very differently once real traffic hits them. We help teams match the deployment model to their actual privacy rules, frameworks and team size – before a licence is signed or a self-hosted cluster is stood up. |
How LLM Observability Works in a Production Architecture
Take one question in a typical RAG app.
The user types it in. Your backend checks who they are, applies business rules and cleans the input. The system then searches your vector database for the most useful chunks of text. Those chunks and the question get packed into a prompt and sent to the LLM. When the answer comes back, guardrails check it for unsafe content, leaked data or broken rules. Last, the logs, metrics and trace get sent to your observability tool in the background.
| One Question, One Trace User asks The question arrives Backend checks Identity, business rules, input cleaning Vector search Retrieve the most useful chunks Prompt assembly Chunks plus the question LLM call The model answers Guardrails Unsafe content, leaked data, broken rules Logs, metrics and the trace go to your observability tool — asynchronously Telemetry should never make the user wait. They get the answer first; the data follows. One question, one trace. Every step becomes a span, and telemetry leaves the request path. |
That last bit matters. Telemetry should never make the user wait. Send it asynchronously, so they get their answer first and the data follows.
Every step becomes a “span” inside one trace. When something looks off, you open the trace and see where time or quality got lost.
Use open standards to avoid lock-in
Consider using OpenTelemetry (OTel) and its GenAI semantic conventions. They’re shared rules for naming and shaping LLM data, like model name, token counts and prompt fields.
The payoff is simple. If your code follows a common standard, you can switch tools later without a big rewrite. You aren’t married to one vendor. In enterprise LLM observability that freedom matters, since contracts and needs change over the years.
| Note on Stability Checked October 2026: the GenAI semantic conventions now live in their own repository, and the GenAI-specific items in it are marked Development, not Stable. That status applies to the spans documented there (Inference, Embeddings, Retrievals, Fetch response and Memory), to the GenAI metrics including gen_ai.client.token.usage and gen_ai.client.operation.duration, and to the gen_ai.* attributes. The Stable labels that appear on those same pages belong to shared core attributes borrowed from elsewhere in the specification, such as error.type, server.address and server.port, so do not read them as a status for the GenAI conventions as a whole. There is no versioned GenAI release and the schema URL is still a placeholder, which means there is nothing to pin against. Adoption is real and the advice above holds in practice, but check the current status of the specific spans, metrics and attributes you depend on, and budget for a migration rather than treating any of it as frozen. |
LLM Evaluation: Measuring Quality Beyond Latency
Speed and cost are easy to measure. Quality is hard.
Say your bot answers 50,000 questions a day. Were they good? You can’t hire enough people to read them all. A keyword check can’t tell if an answer is honest or useful either. That gap is what LLM-as-a-Judge is for.
LLM-as-a-Judge
You use one language model to grade the work of another. Give the judge the question, the answer and sometimes the source documents, then add clear grading rules. It returns a score and a short reason.
| Example Judge Prompt A judge prompt could say: “Here is a question, some source text, and an answer. Does the answer only use facts from the source text? Give a score from 1 to 5 and explain why.” |
You can grade correctness, relevance, faithfulness, tone and safety this way. Tools like DeepEval and TruLens save a lot of work, since they ship with ready-made evaluators for hallucination, answer relevance and context quality. You don’t have to write every judge prompt from scratch.
The appeal is scale. A judge model can work through far more responses than a human reviewer in the same time, and you change the rules by editing a prompt. How closely it agrees with human judgement varies by task, by the rubric and by the model doing the judging, so treat agreement as something you measure rather than assume. Validate the judge against a human-labelled set drawn from your own traffic before you trust its scores, and re-check whenever the rubric, the judge model or the application changes.
| The Reality It has blind spots, though. Plenty of judges prefer longer answers when a short one would do. Some lean toward writing that sounds like their own. And vague rules make the scores wobble. |
A few habits fix most of that. Write very specific rules. Ask for the reason before the score. Keep the scale simple, pass or fail, or 1 to 5. Every so often have real people check a small batch of the judge’s scores, and if you disagree often, the judge prompt needs work.
Dynamic tiered sampling: keep evaluation costs in check
Judge models cost money too. Run a strong one on every request and your evaluation bill might end up bigger than your app bill. Not a fun surprise. (Measuring GenAI ROI gets into how to frame that trade-off.)
The fix is tiered sampling, with the two tiers priced very differently. Traces and metrics are the cheaper tier per unit, but cheap is relative and not a given. The bill moves with traffic volume, payload size – prompts and completions are large compared with ordinary telemetry – how much of it you index for search, what you sample, and how long you retain it. Weigh those against your privacy and data-minimisation obligations and how far back you realistically debug. Plenty of teams keep everything; high-volume systems often sample traces while keeping metrics in full.
Evaluation is the expensive tier. Running LLM-as-a-Judge on 5 to 10% of traffic, picked at random, is a reasonable place to start rather than a universal recommendation. Calibrate it against your evaluation budget and how noisy your quality signal is.
| Dynamic Tiered Sampling Cheaper tier Traces and metrics Volume, payload size, indexing, sampling and retention all move the bill. 5-10% LLM-as-a-Judge A reasonable place to start, calibrated to your evaluation budget and signal noise. Raise the rate when something looks odd A thumbs down A guardrail fired A latency spike A new prompt version Score those at a much higher rate – up to everything that matches Keep the cost in view: a trigger that fires constantly becomes your largest line item. A cheaper tier you size by policy, a judged slice you calibrate, and targeted evaluation when a signal fires. |
The smart part is that the rate isn’t fixed, and the random slice shouldn’t be your only input. Target evaluation at the requests that already carry a failure signal: a thumbs down, a guardrail that fired, an error or latency spike, or a new prompt version going live. Those are worth scoring at a much higher rate, up to everything that matches. Keep the cost of that in view, though, because judge calls are billed like any other model call and a trigger that fires constantly can quietly become your largest line item.
You stay cheap on normal days and thorough on bad ones. A small sample is usually enough to spot a trend, and the trend is what you act on.
Enterprise Integration and Deployment Considerations
Data privacy and compliance
Prompts and answers often hold private information. In healthcare, finance or any regulated field, sending that to an outside service can be a real problem. (Data readiness is usually where this surfaces first.)
Rules like HIPAA and SOC 2 are often cited as a reason to self-host, but neither one mandates it. What they require is that you can account for where regulated data goes and who can reach it. Many teams meet that with a vendor under a business associate agreement or equivalent contract, plus the right security controls. Deployment is a choice you make against your own compliance obligations, your vendor agreements and the controls you can actually operate.
Self-hosting, or running a tool inside your own VPC, is one route to that accounting, and it is a big reason Langfuse and Phoenix are popular in larger companies. Be careful what you assume it buys you, though. It keeps the observability store in your cloud account, under your access rules, but it does not by itself keep all data inside your perimeter: external model APIs, telemetry exporters and third-party integrations can each move data out. Map those paths as deliberately as you pick the deployment. Whatever you choose, ask where the data is stored, who can see it and how long it stays.
PII redaction
Even if you self-host, hide sensitive data before it’s stored. Mask names, emails, phone numbers, card numbers and health details before telemetry leaves your app. Do it at the edge, while the request is still in your own code. Done there, it keeps most private data out of your logs — but redaction is pattern-matching against messy human text, so treat it as reducing exposure rather than eliminating it. Sample your stored telemetry to see what is still getting through, and tighten the rules as you find gaps.
Overhead
Observability shouldn’t slow your app. Report asynchronously, send data in batches, and keep code in the request path small. A well-tuned setup adds little, but tracing is never free. Measure the overhead against your application’s latency budget rather than assuming it away, and if it starts eating into that budget, treat it as a signal to optimise the instrumentation, such as batch sizes, sampling and what you attach to each span. (See how the pieces fit end to end.)
| Privacy rules are usually what stalls the rollout Self-hosting, redaction at the edge, and mapping every path data takes out of your account are solvable problems — they are just rarely solvable in the week before launch. We work through them with platform and compliance teams alongside the instrumentation itself. |
Conclusion and Key Takeaways
Moving a GenAI app from prototype to production is a big jump, and you can’t do it blind. Observability is part of the job here. Logs, metrics and traces show what your system is really doing, so track quality, performance, cost and security together. Latency on its own won’t tell you much.
Pick LLM observability tools that fit your situation. Open source suits privacy needs, framework tools help with fast debugging, gateways make setup easy, and APM tools bring LLM calls alongside the rest of your stack. Use LLM-as-a-Judge to measure quality at scale, and validate it against human review before you lean on the scores. Sample smartly: retain traces and metrics at a level your volume, cost and privacy rules support, evaluate a slice, and raise that slice when trouble shows up. Plan for privacy early, and map every path your data takes out of your own account.
Continuous evaluation is what makes all this worth the effort. Every score tells you something about your prompts, your model choice and your retrieval setup. Act on it, and your app gets a bit better each week.
| Key Takeaways
Four groups, one screen Quality, performance, cost and security – split across tools, nobody sees the picture.
Pick by fit, not features Open source, framework-native, gateway or APM – find your camp first.
Validate the judge Check LLM-as-a-Judge against human labels before you lean on its scores.
Sample dynamically Cheap on normal days, thorough when a failure signal fires. |
| Next Step We help enterprises take GenAI applications from prototype to production: instrumenting traces, standing up evaluation pipelines, and putting quality, cost and safety on one screen before launch rather than after. Explore our Generative AI services, or talk to our team at impressico.com/contact-us. |
Impressico Business Solutions – GenAI engineering, observability and production readiness for the enterprise.

IBS
Similar articles

Hybrid Search: Combining Semantic and Keyword Retrieval for Better RAG Results
September 21, 2026
Chunking Strategies for RAG: What Actually Works in Production
September 16, 2026
Vector Databases Compared: Pinecone vs Weaviate vs Qdrant vs pgvector for Enterprise RAG
September 14, 2026
RAG at Scale: Enterprise Retrieval-Augmented Generation Architecture
September 11, 2026
7 Signs Your Organization Is Ready for AI Agents
August 14, 2026
Governance and Safety for Autonomous AI Agents: A Practical Guide for Enterprises
August 3, 2026
