May 6, 2022
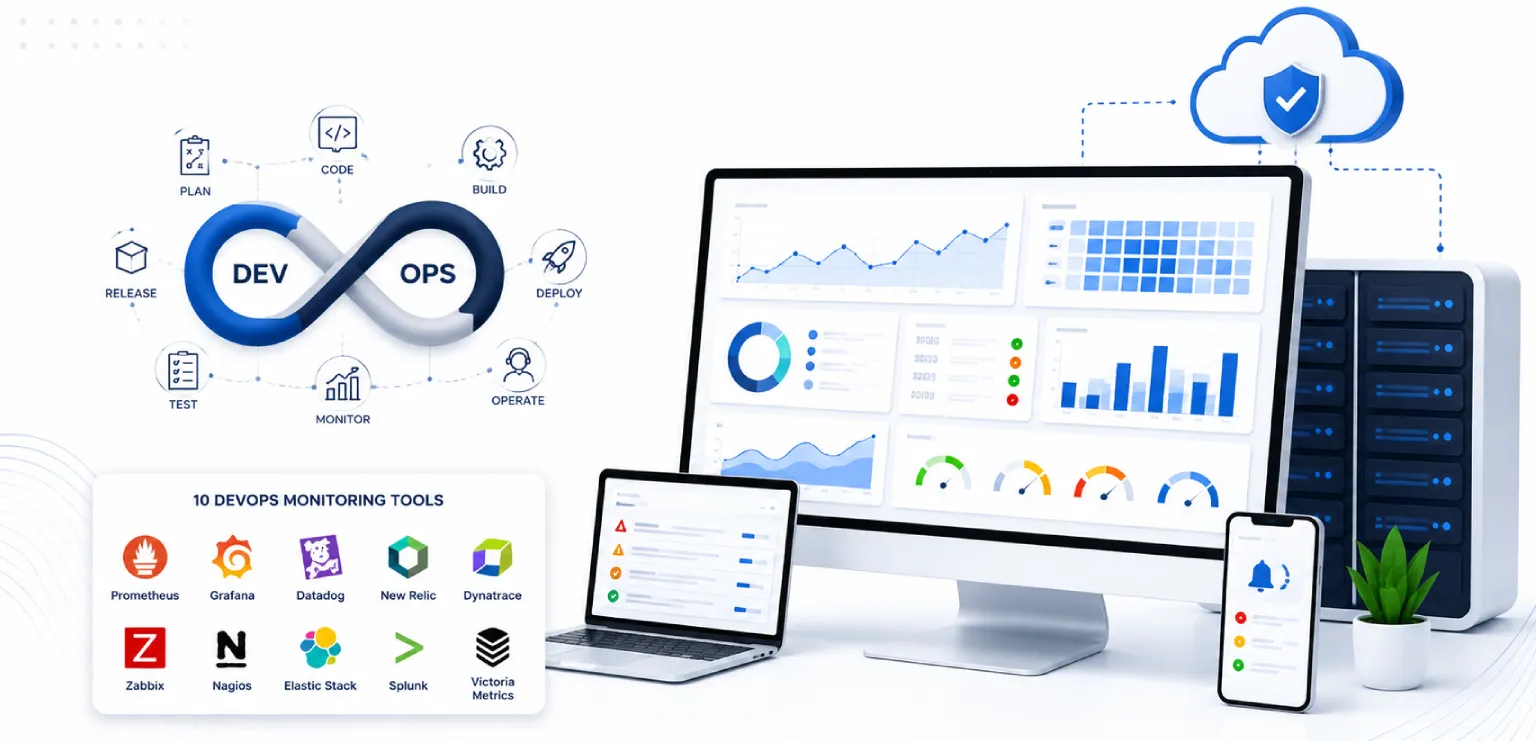
DevOps Monitoring Tools: The 10 That Matter in 2026
Enjoying this article?
Share it with the world!


What DevOps Monitoring Actually Means
|
⚡ Quick Answer DevOps monitoring is the practice of collecting and acting on operational signals — metrics, logs, and traces — across the whole delivery pipeline and the running system. Most teams end up with a small stack rather than one tool: something to collect (OpenTelemetry), something to store and query metrics (Prometheus), something to visualise (Grafana), something for logs (Elastic or Splunk), and something to route alerts to humans (PagerDuty). Commercial platforms like Datadog, Dynatrace, and New Relic bundle those layers at the cost of flexibility and, usually, budget. |
A definition worth getting right before comparing tools
DevOps monitoring is the continuous collection, analysis, and alerting on signals produced by your applications, infrastructure, and delivery pipeline. It spans both sides of the release boundary: build and deployment health on one side, runtime behaviour on the other. The point is not dashboards. The point is knowing that something is wrong, ideally before a customer tells you, and having enough context to find the cause quickly.
Modern practice organises the signals into three types. Every tool below handles at least one of them well, and the main reason teams end up with sprawling tool estates is buying separately for each without deciding how they connect.
|
The Three Signal Types
Metrics tell you something broke. Traces tell you where. Logs tell you why. |
Monitoring sits underneath everything else in operations. It is the data source for incident response, the evidence base for DevOps metrics like MTTR and change failure rate, and the prerequisite for any AI-assisted operations work — you cannot correlate signals you never collected.
The 10 DevOps Monitoring Tools Worth Evaluating
Grouped by the job they do, because most teams need two or three, not one
These are ordered roughly by where they sit in a stack rather than by preference. A team running Kubernetes with a modest budget will land on a different subset than an enterprise consolidating twelve legacy tools.
|
01 · Instrumentation standard · Open source OpenTelemetry Not a monitoring tool but the layer everything else now plugs into. OpenTelemetry gives you one vendor-neutral way to emit metrics, logs, and traces, so switching backends later does not mean re-instrumenting every service. It is a CNCF project and has become the default answer to “how do we avoid vendor lock-in on telemetry?” Best for: any team instrumenting from scratch, or one that expects to change vendors. |
|
02 · Metrics & alerting · Open source Prometheus The default metrics engine for cloud-native systems. Pull-based scraping, a dimensional data model, and PromQL for querying. Alertmanager handles routing, deduplication, and silencing. Its weak point is long-term storage at scale, which is why teams pair it with Thanos, Mimir, or Cortex once retention becomes a requirement. Best for: Kubernetes and container workloads; teams that want control over cost. |
|
03 · Visualisation · Open source + SaaS Grafana The visualisation layer that sits on top of almost anything — Prometheus, Elasticsearch, cloud provider metrics, SQL databases. The wider Grafana stack now includes Loki for logs and Tempo for traces, which makes an all-open-source observability platform realistic without a commercial contract. Best for: unified dashboards across mixed data sources. |
|
04 · Full-stack platform · Commercial SaaS Datadog The most widely adopted commercial observability platform, covering infrastructure, APM, logs, synthetics, RUM, and security in one product with several hundred integrations. Deployment is fast and the breadth is genuine. The recurring complaint is billing complexity — costs are metered across many dimensions and can escalate quickly without governance. Best for: teams that want one vendor and can manage the spend. |
|
05 · APM & AI analysis · Commercial Dynatrace Built around automatic discovery and dependency mapping, with its Davis AI engine performing causal root cause analysis rather than statistical correlation alone. Strong in large, complex enterprise estates where manually maintaining a service map is impractical. Priced accordingly. Best for: large hybrid environments needing automated root cause analysis. |
|
06 · APM & full-stack · Commercial New Relic A long-established APM vendor that moved to consumption-based pricing built around data ingested and billable users, which suits teams with many occasional viewers and a few heavy users. Good OpenTelemetry support and a usable free tier make it a common starting point for smaller engineering organisations. Best for: application-centric teams; predictable per-user cost models. |
|
07 · Log analytics & search · Open source + commercial Elastic Stack (Elasticsearch & Kibana) Elasticsearch stores and searches log data; Kibana provides the query interface and dashboards. Together they remain the most common self-hosted log platform, and Elastic has extended into APM and observability. The trade-off is operational: running Elasticsearch well at scale is a real engineering commitment in cluster sizing, sharding, and index lifecycle management. Best for: high log volumes where data residency or cost rules out SaaS. |
|
08 · Enterprise log analytics · Commercial Splunk (now part of Cisco) Splunk indexes and searches machine-generated data across networks, servers, and applications, and remains dominant where security and operations converge. Cisco completed its acquisition of Splunk in March 2024 for roughly $28 billion, and the portfolio is being integrated with Cisco’s observability and security lines — worth factoring into any long-term commitment. Best for: enterprises with overlapping SIEM and operations requirements. |
|
09 · Infrastructure monitoring · Open source Zabbix Mature open-source monitoring for servers, network devices, databases, and virtual machines, with agent-based and agentless collection and no licence cost. It covers the traditional infrastructure estate that cloud-native tools often handle poorly — which is precisely why hybrid organisations keep it alongside Prometheus rather than instead of it. Best for: on-premise and hybrid infrastructure; network device monitoring. |
|
10 · Incident response · Commercial PagerDuty Monitoring detects; PagerDuty decides who gets woken up. On-call scheduling, escalation policies, alert grouping, and incident workflows, integrated with essentially every tool above. Teams frequently underinvest here and then wonder why detection improvements did not shorten resolution time. Best for: any team with a rotation; the connective tissue between alert and human. |
|
Running more monitoring tools than you can name? Tool sprawl is usually the result of buying per-problem rather than per-signal. Consolidation typically cuts spend and shortens investigation time at the same time. |
What Happened to the Tools on the Old Lists
Several names that dominated DevOps monitoring round-ups no longer exist
If you are comparing this against an older article — including earlier versions of this one — several tools have been retired, renamed, or acquired. Any list still recommending them has not been maintained.
|
Librato — retired SolarWinds folded Librato into AppOptics, which reached end of service life on 31 January 2026. The Heroku add-on was removed in February 2026. Current equivalent: SolarWinds Observability, or any of the metrics tools above. |
|
Datical — renamed Liquibase The company rebranded to Liquibase in May 2020. Worth noting that it is database release automation, not monitoring — it belonged in a different category all along. |
|
Tasktop — now part of Planview Acquired and rebranded under Planview. Like Datical, it was never a monitoring product — it handles value stream integration between delivery tools. |
|
Nagios and Sensu — still running, rarely chosen new Both remain in production at many organisations and neither is dead. But greenfield projects overwhelmingly start with Prometheus or Zabbix, so these are maintenance considerations rather than evaluation candidates. |
How to Choose Without Ending Up With Twelve Tools
Four questions that narrow the field faster than a feature matrix
|
|
Key Takeaway Choose the instrumentation standard first and the backend second. Teams that pick a vendor first and instrument to its agent spend the next migration rewriting every service; teams that start with OpenTelemetry can change their mind for the cost of a config change. |
Four Mistakes That Undermine Good Tooling
Alerting on everything. An alert that does not require action trains people to ignore alerts that do. If nobody would get out of bed for it, it is a dashboard panel, not a page.
Monitoring infrastructure but not user experience. Every host can be green while checkout is failing. Synthetic checks and real user monitoring catch what CPU graphs cannot.
Treating cost as someone else’s problem. Observability spend grows with traffic, and unlike compute it rarely gets reviewed. Set retention policies and sampling rates deliberately, at the start.
Buying tools instead of defining process. No platform decides who owns an incident. Alert routing, escalation, and ownership are organisational choices that tooling only enforces.
Once monitoring is solid and alerts are meaningful, the next step for most teams is adding intelligence on top — correlating signals and shortening investigation. That is the subject of AIOps in Practice: Using AI to Cut Incidents and MTTR, and it depends entirely on the data quality your monitoring layer produces.
|
Key Takeaways
|
Frequently Asked Questions
|
What is DevOps monitoring? The continuous collection and analysis of signals from applications, infrastructure, and the delivery pipeline, used to detect problems and diagnose them quickly. It covers both pre-production (build and deployment health) and production (runtime behaviour). |
|
What is the difference between monitoring and observability? Monitoring tells you whether known conditions are met — is latency above threshold, is the disk full. Observability is the property of a system that lets you answer questions you did not anticipate, which requires richer, higher-cardinality data. Monitoring answers known questions; observability supports unknown ones. |
|
Which DevOps monitoring tool is best for Kubernetes? Prometheus with Grafana is the standard open-source combination, and Kubernetes exposes metrics in Prometheus format natively. Datadog and Dynatrace both offer strong managed alternatives if you would rather not operate the storage layer yourself. |
|
Are open-source monitoring tools actually cheaper? In licence cost, yes. In total cost, it depends on whether you have engineers to run them. Self-hosting Prometheus at scale means owning storage, retention, high availability, and upgrades. For small teams the staff cost often exceeds the SaaS bill it replaced. |
|
How many monitoring tools should a team have? Fewer than most have. A workable minimum is one collection standard, one metrics backend, one log platform, one visualisation layer, and one alerting tool — and several of those can come from a single vendor. Beyond that, each additional tool adds another place to look during an incident. |
|
Do we still need monitoring tools if we adopt AIOps? Yes. AIOps analyses the data monitoring produces; it does not collect it. Adding AI on top of thin or inconsistent telemetry produces confident, unreliable conclusions. Fix the collection layer first. |
|
Build a monitoring stack you can actually operate Impressico helps engineering teams consolidate monitoring estates, instrument with OpenTelemetry, and turn alert noise into signal — across cloud, hybrid, and on-premise environments. |
Similar articles
Compliance-as-Code: Automating SOC 2, HIPAA, and PCI-DSS in CI/CD Pipelines
September 9, 2026
Shift-Left Security in CI/CD Pipelines: A Practical Playbook
September 4, 2026
DevSecOps: Shifting Security Left Without Slowing Delivery
September 2, 2026
Is Your Engineering Team Ready for Platform Engineering? A Readiness Checklist
August 12, 2026
Measuring Platform Engineering ROI: DORA and SPACE Explained
July 31, 2026
Internal Developer Platforms: Building a Golden Path for Engineering Teams
July 22, 2026